Basically, an explicitly defined function in 3d is given by (x$ of the ordinary derivative of a real-valued function of a real variab$
z=x*y^4+cos(x)*sin(y)
partial w/ respect to x = y^4-sin(x)sin(y)
partial w/ respect to y = 4*x*y^3+cos(x)*cos(y)
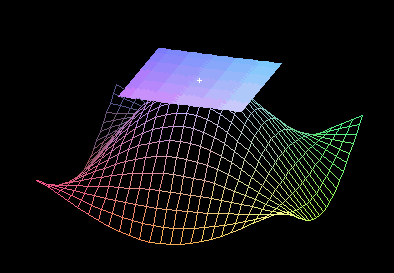
We need to define a plane that has both partials as slopes on its coordinate curves z = f(x0,y0)+ (x-x0)(paritial of x at (x0,y0))+ (y-y0)(partial of y at (x0,y0)) Where (x0,y0) is the specific point in this case.
Also, we can think of partial(x) as expected increase in z over an increase of 1 in x, and partial (y) as an expected increase in z over an increase of 1 in y. So we can use the vectors [1, 0, partial(x)] and [0, 1, partial (y)] as tanget vectors. Now that we have tangent vectors we can parameterize a plane from them, and add the [x0, y0, z0] that forms the point of tangency to get the tangent plane.
f(x,y) = 1+ 2x^2+ 2y^2 at (1,1)
partial w/ respect to x at (1,1) = 4
partial w/ respect to y at (1,1) = 4
So our tangent plane is: z = f(1,1)+ (x-1)(4)+ (y-1)(4) = 4x+4y-3
A. First find the partial derivatives with respect to x and y at (1,2)
B. Now, use the above formula for the tangent plane and find z = f(x,y) at (1,2)
C. Sketch (roughly) where the tangent plane lies and the point of tangency to the graph.
D. Use the GraphTan program to check your answer against the
answer GraphTan gives. To load the GraphTan command, paste in the maple code that defines the GraphTan
function. Then type
GraphTan(function,x=xmin..xmax,y=ymin..ymax,point=[x0,y0]);
Note: you will have to replace the names with values of your own in GraphTan
Do your answers above agree with the plot given by Maple?
Back: Introduction