Introduction to Models of CO2 Concentration
The concentration of carbon-dioxide (CO2) in lakes and rivers
plays a central role in
the health of those aquatic ecosystems. Plants take CO2 out of the water
during the day for photosynthesis and add CO2 to the water at
night. Animals always exhale carbon-dioxide into the water as they
breathe. The ecosystem will be in a healthy equilibrium when there is roughly
the same amount of CO2 entering the water as leaving it. When
CO2 concentrations rise too high, algae growth dramatically
increases: the body of water "blooms" and becomes covered by a dense layer
of algae. At this point, the underlying water becomes oxygen and
light deprived, and is no longer capable of sustaining a diversity of
life forms. In effect, the ecosystem may die.

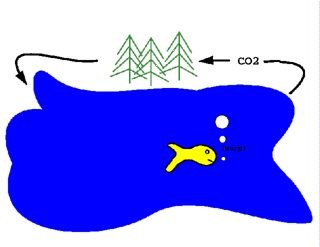
Figure 6: A healthy, happy lake.
Limnologists (scientists who study freshwater environments) monitor
carbon-dioxide levels in lakes and rivers in order to intervene,
should the ecosystem become threatened. (For example, by running a
water cannon, such as those one often sees in the lakes in front of
corporate headquarters, more oxygen is mixed into the water.)
However, one type of testing yields
measurements of CO2 production rates, as
opposed to concentrations.
The rate at which carbon-dioxide is produced is a function of time. To
obtain information about the concentration of CO2, we must add
up all of the instantaneous changes. In other words, we must
integrate the rate of change.
Since the scientist only has the data points he or she collected, it
is necessary to choose a model function for the data. The model
function can then be integrated exactly to produce a numerical
estimate for the total CO2 concentration.
In order to know when to intervene in an
endangered lake, a limnologist must also have an idea of the accuracy
of the estimate.
Question 6
Suppose a model function R(t) representing the rate of change
of carbon-dioxide in a river over a 24 hour period has been chosen. That
is, R(t) represents the rate at which CO2 is entering
or leaving the river at time t.
- By knowing the model function and the concentration of
CO2 in the river at the beginning of the 24 hour period,
describe how you could estimate the concentration at the end of the
period.
- Use mathematical notation to describe the "concentration
function", C(n), that gives an approximate CO2
concentration after n hours have passed. Explain your
notation clearly enough for another student to easily decipher it. (Hint:
express C(n) in terms of an integral involving R(t).)
In the next pages, we put these ideas into practice by numerically
integrating actual CO2 rate data
collected over a 24 hour period starting at dawn, and analyzing
the results.
Next:Choosing a Good Model Function
Previous:More Complicated Models
Return to:Introduction
The Geometry Center Calculus Development Team
A portion of this lab is based on a problem appearing in
the Harvard Consortium Calculus book, Hughes-Hallet, et al,
1994, p. 174
Last modified: Fri Jan 5 09:50:51 1996
