![[HOME]](/pix/home.gif) The Geometry Center Home Page
The Geometry Center Home Page
ri = yi - F(xi).
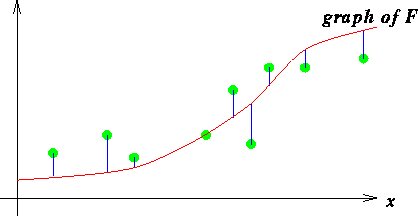
The residuals indicate the vertical distance from our function at xi to our data point. If residuals are large, then our function is not very close to the data points. To get a global view of how close F is to the set of all data points, we might try to add up the residuals. Unfortunately, however, some residuals that are positive might cancel with others that are negative, and so we might find that the sum of the residuals is nearly zero, even though our function does not pass close to any of the data points.
A more useful estimate is to compute the sum of the squares of the residuals. The square of a residual is always positive, so if the sum of the squares of the residuals is a small number, then our function passes close to many of the data points. This is the method used by the well-known statistical method of linear regression, also known as the method of "least-squares fit".
The Geometry Center Home Page
Comments to:
webmaster@geom.umn.edu
Created: May 15 1996 ---
Last modified: May 15 1996
Copyright © 1996 by
The Geometry Center
All rights reserved.