Next: Questions on Dynamical Systems
Up: Table of Contents
Prev: Linear and Nonlinear Functions
MODULE: Dynamical Systems.
Part 5: Bifurcation
Now that you have had a chance to think about bifurcations, you will
look at a new graph called the orbit diagram. This is a
way of testing the eventual behavior of bounded orbits (that is, the
orbits which do not just go off to infinity.) Consider the following
conclusions from the previous section: for f(x)=x^2, orbits of points
between -1 and 1 converge to the fixed point 0. For some negative
value of c, both fixed points are repelling, and an attracting period
two point has appeared. This section describes another method of
finding bifurcations using Chaos Lab #3.

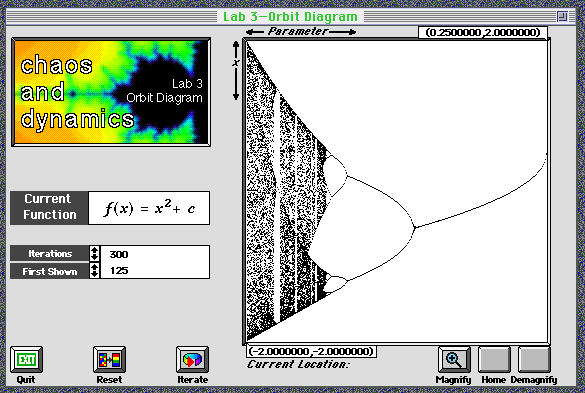
The orbit diagram for the quadratic family seen in Chaos Lab #3.
The picture above is called the orbit diagram for the quadratic family
f_c(x)=x^2+c. Here is how it has been plotted: Each horizontal value
corresponds to a value of the parameter c. The vertical values
correspond to the values of iterates. The program begins by iterating
but does not display for the number of iterates in the First
Shown box. As before, this removes transients. It then displays
the number of iterates in the Iterations box.
Notice that for c near 0, there is only a single point for each value
of c. This corresponds to the fact that for these values of c, the
fixed point is attracting. Use the following procedure to study the
orbit diagram and answer the questions below.
How to Study the Orbit Diagram
- Start Chaos Lab #3. Change the current function to quadratic, and
click on the Iterate button.
- To get a picture more accurately reflecting the eventual
attracting behavior, increase the numbers in the First Shown and
Iterations boxes.
- To look at a particular area, select the area with your mouse,
and click on the Magnify button.
Questions
- Between -0.4 and -1.1, the orbit diagram curve
splits into two branches. How does this relate to what you saw in
Chaos Lab #2? Why are there two branches now? What do they correspond
to? (Hint: What was the eventual behavior of points in this region?)
- Investigate further bifurcations as c decreases. Describe the
sequence of bifurcations. In other words, how does the period of the
attracting set change at each bifurcation?
- How would you describe the orbit diagram near c=-2?
Next: Questions on Dynamical Systems
Up: Table of Contents
Prev: Linear and Nonlinear Functions
![[HOME]](/pix/home.gif) The Geometry Center Home Page
The Geometry Center Home Page
Author: Evelyn Sander
Comments to:
webmaster@geom.umn.edu
Created: Jun 09 1996 ---
Last modified: Jul 31 1996


![[HOME]](/pix/home.gif) The Geometry Center Home Page
The Geometry Center Home Page