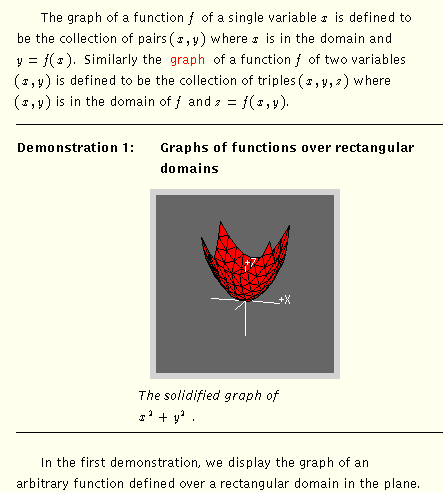
When students log on to this program, they are given text and pictures. The picture is "live", so that selecting the picture gives a control panel and two windows containing the domain of the function and its graph. By moving the mouse in the window containing the function graph, it is possible to rotate the graph in three-space in real time, either in wire-frame or in solid mode.

To view the surface rotating in three-space, select the picture.
Students can make changes in the surface definition to see the effects in the function graphs. It is also possible to choose to display the domain of the function as a subset of the horizontal coordinate plane, so that even in the very first demonstration, students are challenged to observe and make conjectures about the way a surface intersects a plane. Students can always choose to look at the graph from the viewpoint of the z-axis (or the negative z-axis), or from any other axis. They can also alter the resolution of the graph in order to get a better idea of the nature of the intersection of a function graph and its tangent plane at the origin.
Next: Partial Derivatives, Geometrically Considered