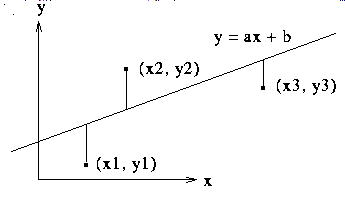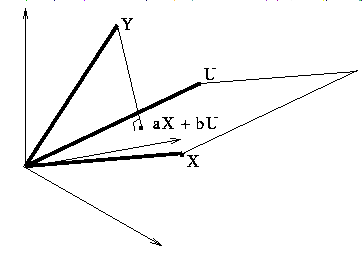

Let Y denote the vector in R^n with components yi, let X denote the vector with components xi, and let U denote the vector in R^n with all components 1,
The two equations can then be written using the dot product: (Y - aX - bU).X = 0 and (Y - aX - bU).U = 0. Thus Y - aX - bU is perpendicular to X and U, so to the entire plane spanned by X and U. It follows that the a and b that give the minimum for the sum of the squares above are the same as the a and b for which aX + bU is the projection of Y into the plane spanned by X and U.

Note that we can set up the original projection problem as a maximum-minimum problem. For a vector Y, we seek the minimum distance to the plane spanned by X and U, and this is equivalent to finding the minimum of the square of the distance. Thus we form the function f(a,b) = (Y - aX - bU).(Y aX -bU) and minimize as usual by taking the partials with respect to a and b and setting them equal to zero.
At this point, if you have access to the program Fnord, you may run an interactive demonstration of this process by typing "fnord LSq" or by selecting Fnord. This demonstration shows three sample points in the plane in one window, and the vectors U, X, and Y in another. Choosing various values of a and b will determine the distance of Y to vectors aX + bU, and the idea is to find the minimum by finding the best values for a and b.
Note that the vectors X and U will only be linearly dependent if X is a multiple of U, so that the observations have the same x-value. That is usually not the situation that interests people like statisticians who want to fit the data to a line in the plane, but in this case, we could say that the best approximating line is the vertical line through the common value of xi.
The values of a and b can be expressed explicitly in terms of determinants involving dot products of X, Y, and U with themselves and with each other, where the denominator is always the non-zero quantity (X.X)(U.U)-(X.U)(X.U). Is there a geometric interpretation for the values a and b?
Explain how the above argument finds the best approximating plane to a collection of observations {(xi, yi, zi), i = 1, 2, ... n} in R^3. Generalize to a collection of observations in R^m, with appropriate notation for the original observations.
What if we want the best approximating line to the collection of data points in the previous paragraph? Is there a least squares approach that would work here?